
Pre-Merge insights into the proto-PBS ecosystem was opaque and limited. Since The Merge and the implementation of proto-PBS via MEV-Boost a vibrant and open ecosystem has emerged. With that a plethora of dashboards built by the community have emerged to monitor relays, validators, and block builders. We’ve compiled a list of notable dashboards to help you navigate them all.
Notable Web3 Dashboards
Mevboost.org
Link: https://www.mevboost.org/
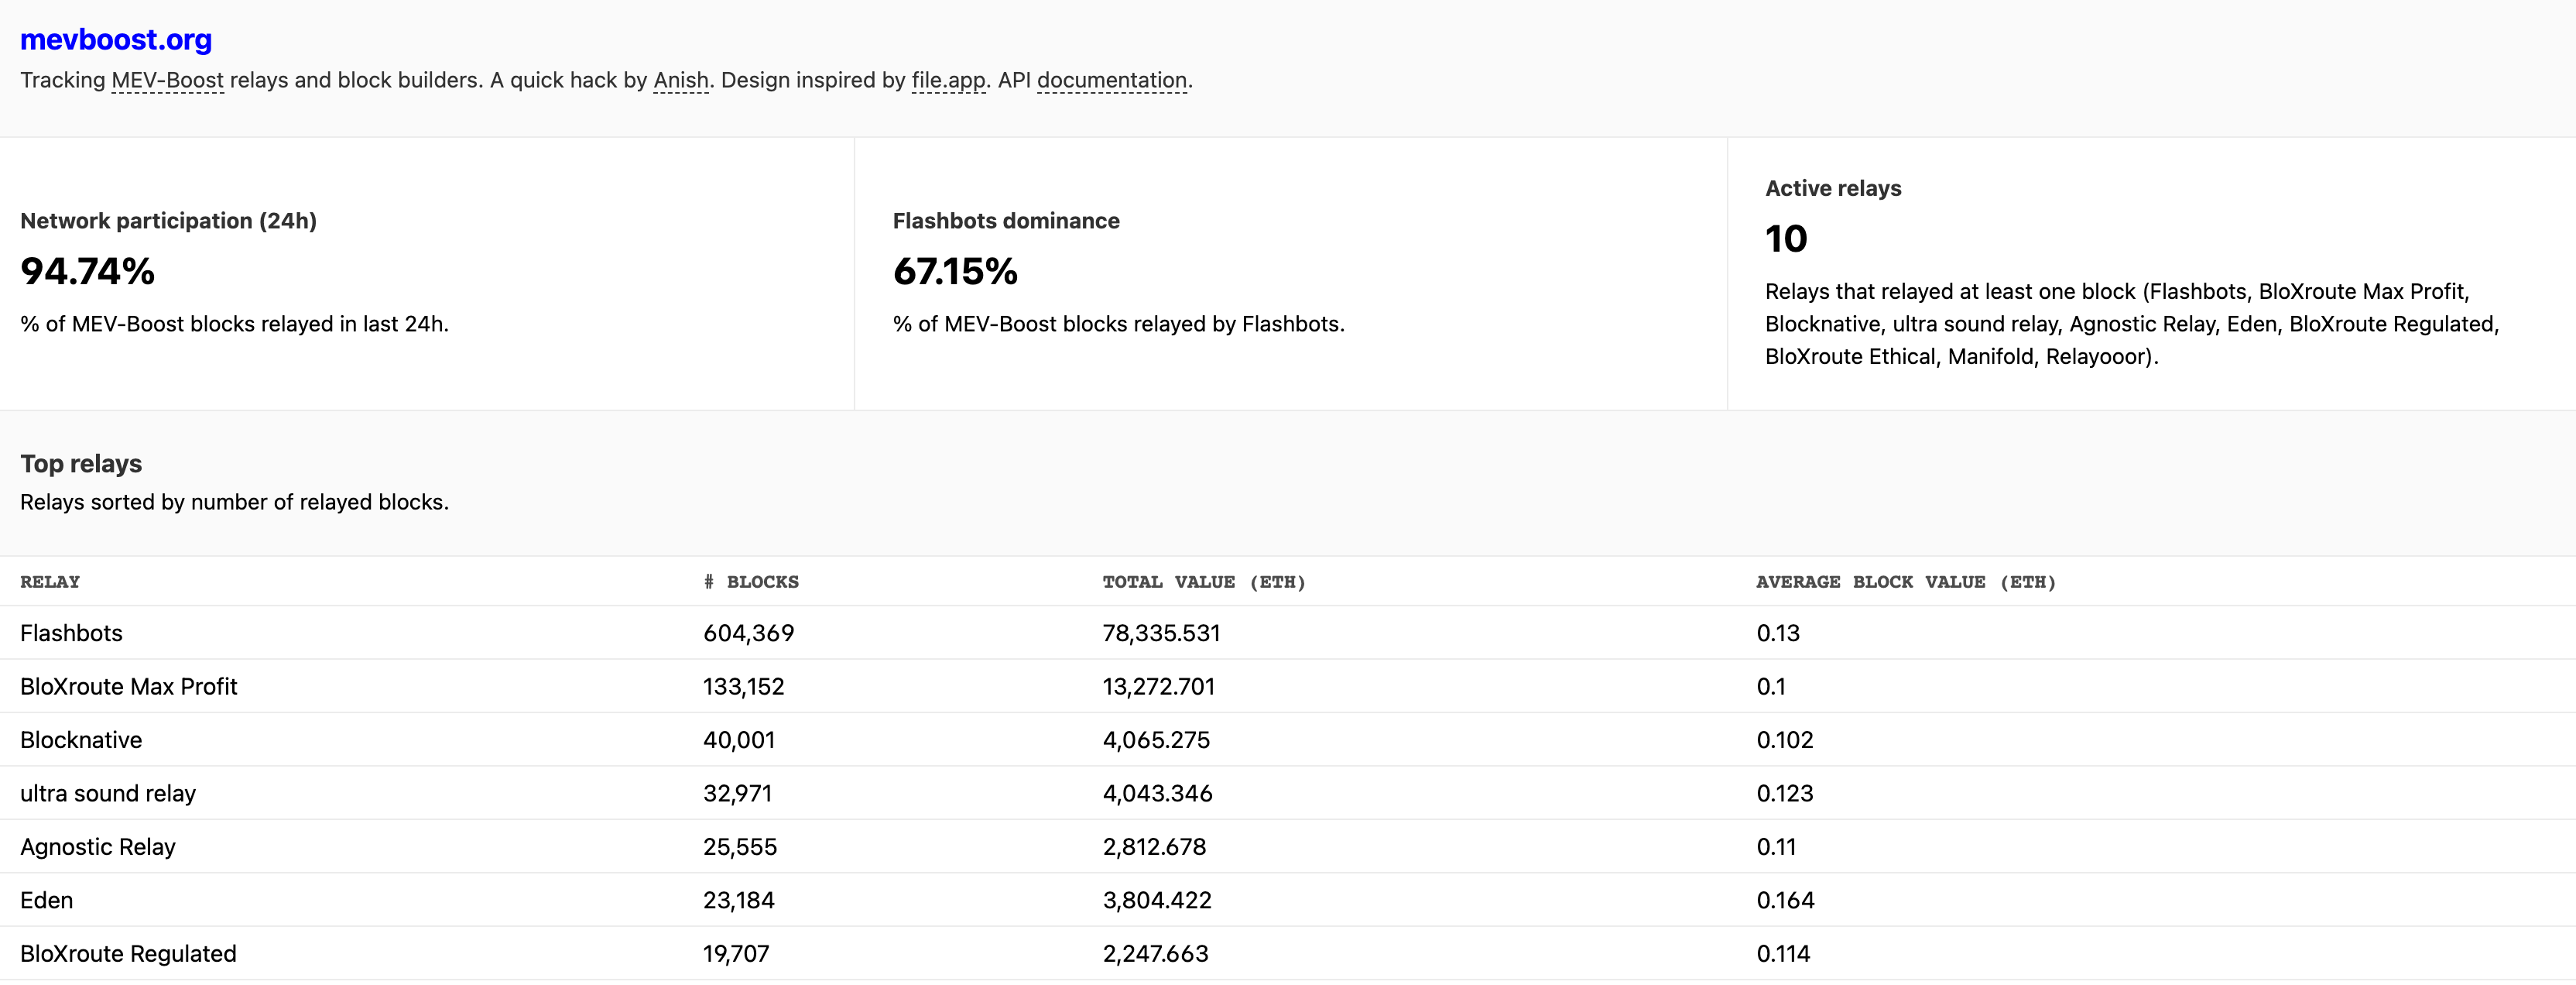
Mevboost.org is one of the OG dashboards that was live at the merge. Use this dashboard to see an overview of relay performance (blocks won, total eth value, average block value), MEV-boost overall network participation, # of relays in the ecosystem, and top builders based off of built blocks.
- Purpose: Leaderboard for relays and builders. Provides a simple & clear overview of PBS network health and adoption.
- Audience: relay operators, block builders, searcher, validators
- Created by: Anish
- Open Source: ✅
- Cost: Free
This dashboard is great for a general overview of the state of the ecosystem but you’ll want to use other dashboards to take a deeper look into different dimensions of the proto-PBS ecosystem.
Relayscan.io
Link: https://www.relayscan.io/
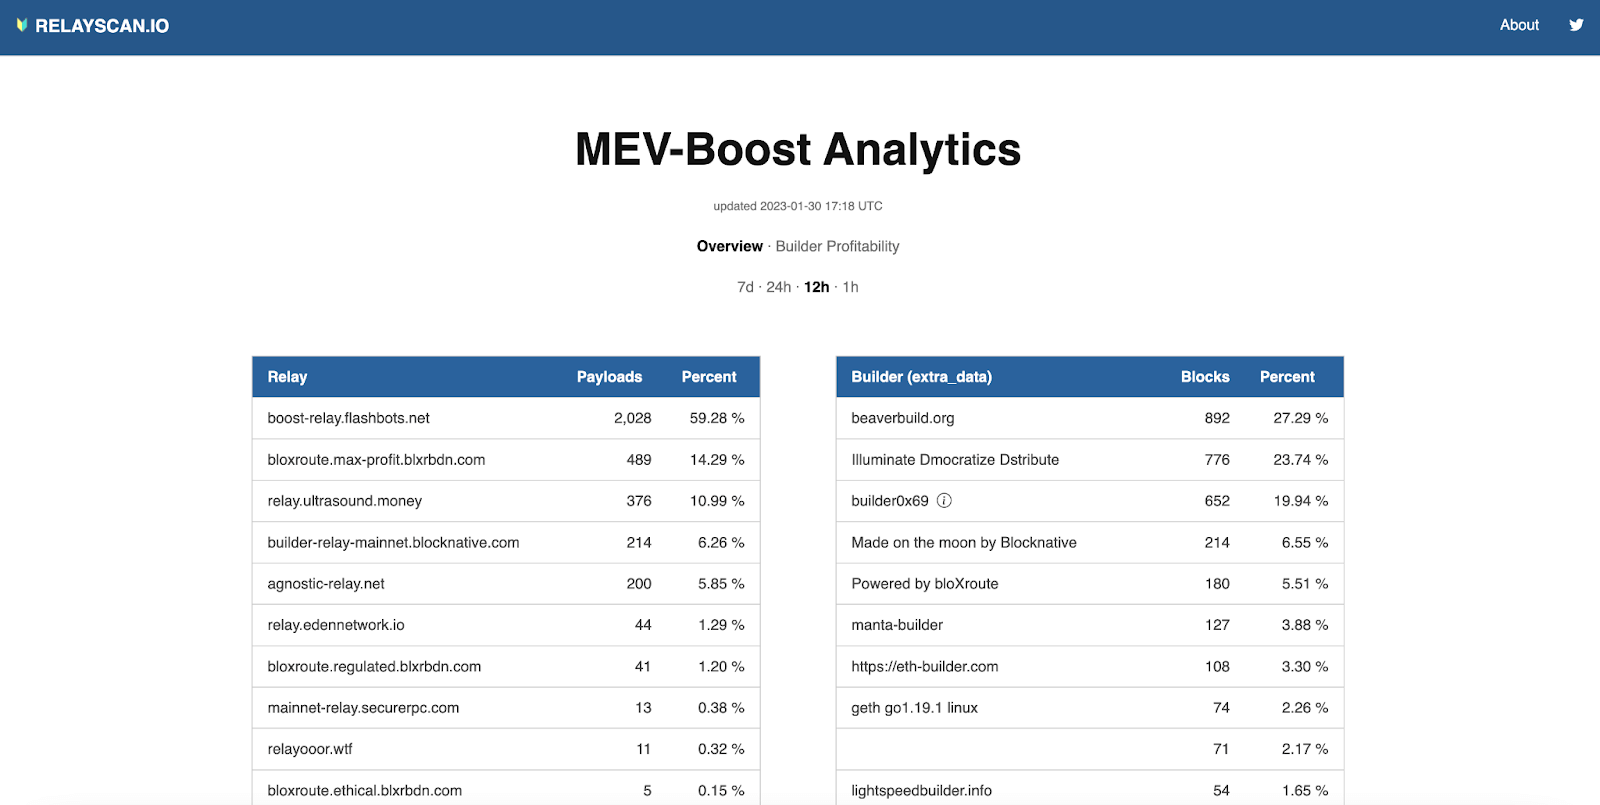
This dashboard collects and compiles data on MEV-Boost relays and builders and gives you more insight into what is happening behind the hood. You can toggle between different time dimensions (7d, 24h, 12h, and 1h) to see trends. The overview tab gives a leaderboard of the relays and builders with some cool functionality on hover over the relays. On the builder profitability tab the builder leaderboard is dissected further allowing you to glean more insight into builder strategies such as subsidies and profit they are taking from their blocks.
- Purpose: MEV-Boost relay & builder analytics
- Audience: relay operators, block builders, searcher, validators
- Created by: Flashbots
- Open Source: ✅
- Cost: Free
Tips:
- On the overview tab hover over each relay to see what builders compromise of the most winning blocks per relay
- Toggle between the different time options to see trends and changes
- You can download the 24hr views into markdown using these links: top relays & builders, builder profit
Metrika Relay Monitor
Link: https://app.metrika.co/ethereum/dashboard/mev/relay-overview
- Purpose: Real time monitoring of bids, blocks and latency of MEV Relays.
- Audience: validators, relay operators
- Created by: Metrika, with input from Flashbots and a grant from Lido
- Open Source: ✅
- Cost: Free
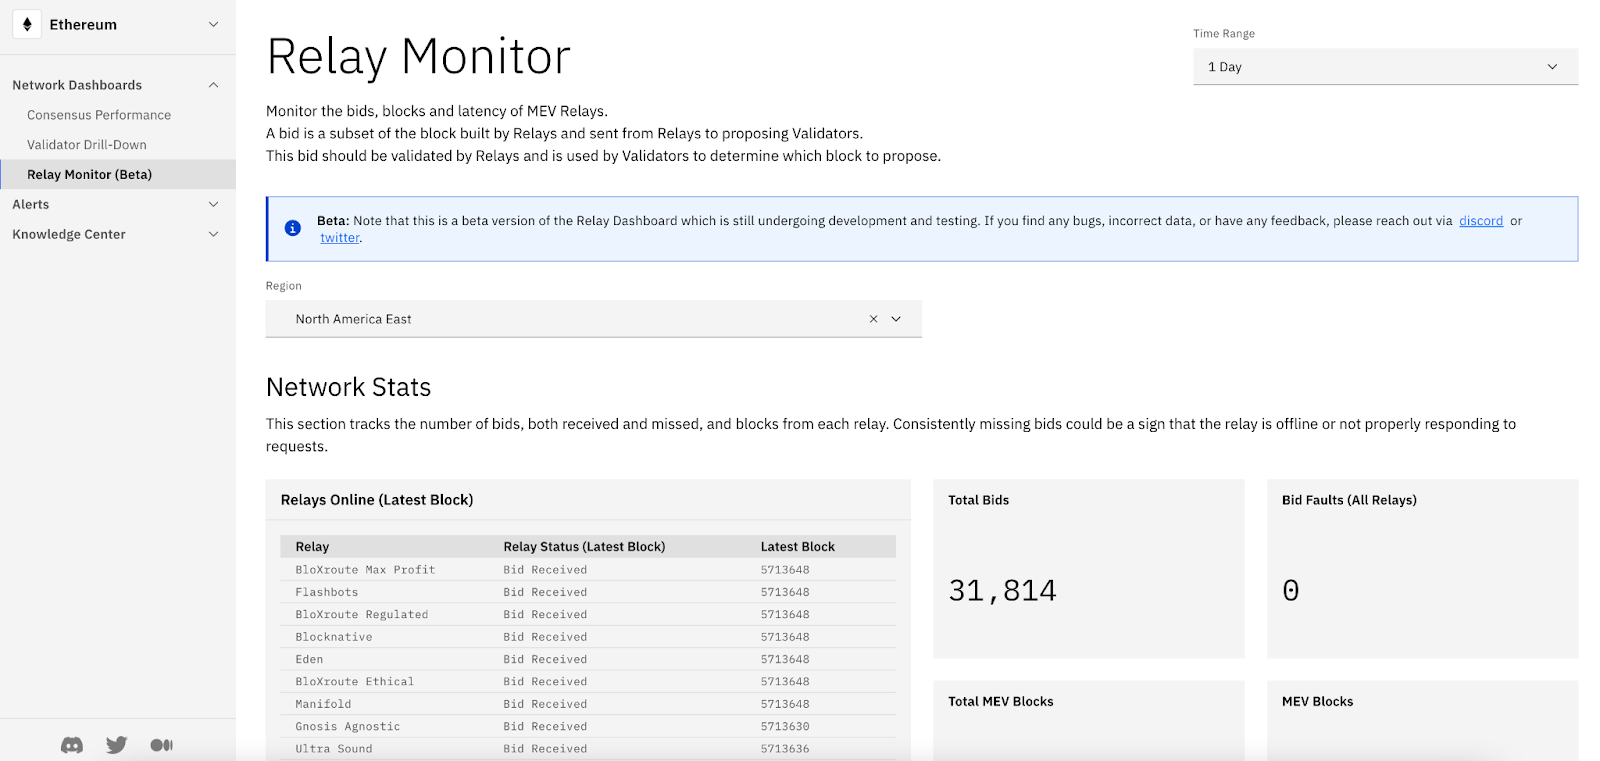
This dashboard focuses on providing relay performance metrics so that Node Operators/Validators can monitor the performances of relays and be alerted in real time to make adjustments if necessary. It is a great all-around dashboard that compiles the best of all dashboards in one place and provides important information for validators/node operators using MEV-Boost.
Metrika prioritizes early warning signs that a relay is not performing so that validators can act accordingly. One of the first things you see on the dashboard is bid metrics which are the bids that relays send to validators when they have a getHeader request. Missing bids doesn’t affect a validator but could be an early sign that relays are offline or not responding correctly. Another notable feature is the latency graphs. Metrika does a great job of visually showing the latency of relays in comparison to other relays allowing validators to compare and contrast different relays and their performance over geographic regions.
Note: Metrika has noted that after 6 months the dashboard will only be free for node operators with ≤5 validators.
Beaconstate
Link: https://mev-relays.beaconstate.info/
![]()
- Purpose: Monitor the uptime of relays
- Audience: validators, relay operators
- Created by: unknown
- Open Source: ❌
- Cost: Free
Beaconstate was one of the first dashboards post merge and monitors the uptime, latency, and average load time. The home screen clearly shows you if relays have gone offline - a green mark is 0-1 min offline while yellow and red show longer outages. From the home screen you can click into each relay to get more details including latency per geographic region and uptime per month.
Note: beaconstate has had several instances where it has gone down and relays jumped back up to 100% total uptime so we recommend looking at the 24 hour, 7 day, and 30 day uptime windows. Additionally, to the best of our knowledge, the code is not open source so we could not double check the logic.
Mevboost.pics
Link: http://mevboost.pics/
- Purpose: Provides visualization and downloadable files on MEV-Boost
- Audience: relay operators, block builders, searchers, validators
- Created by: Toni Warhrstätter
- Open Source: ✅
- Cost: Free
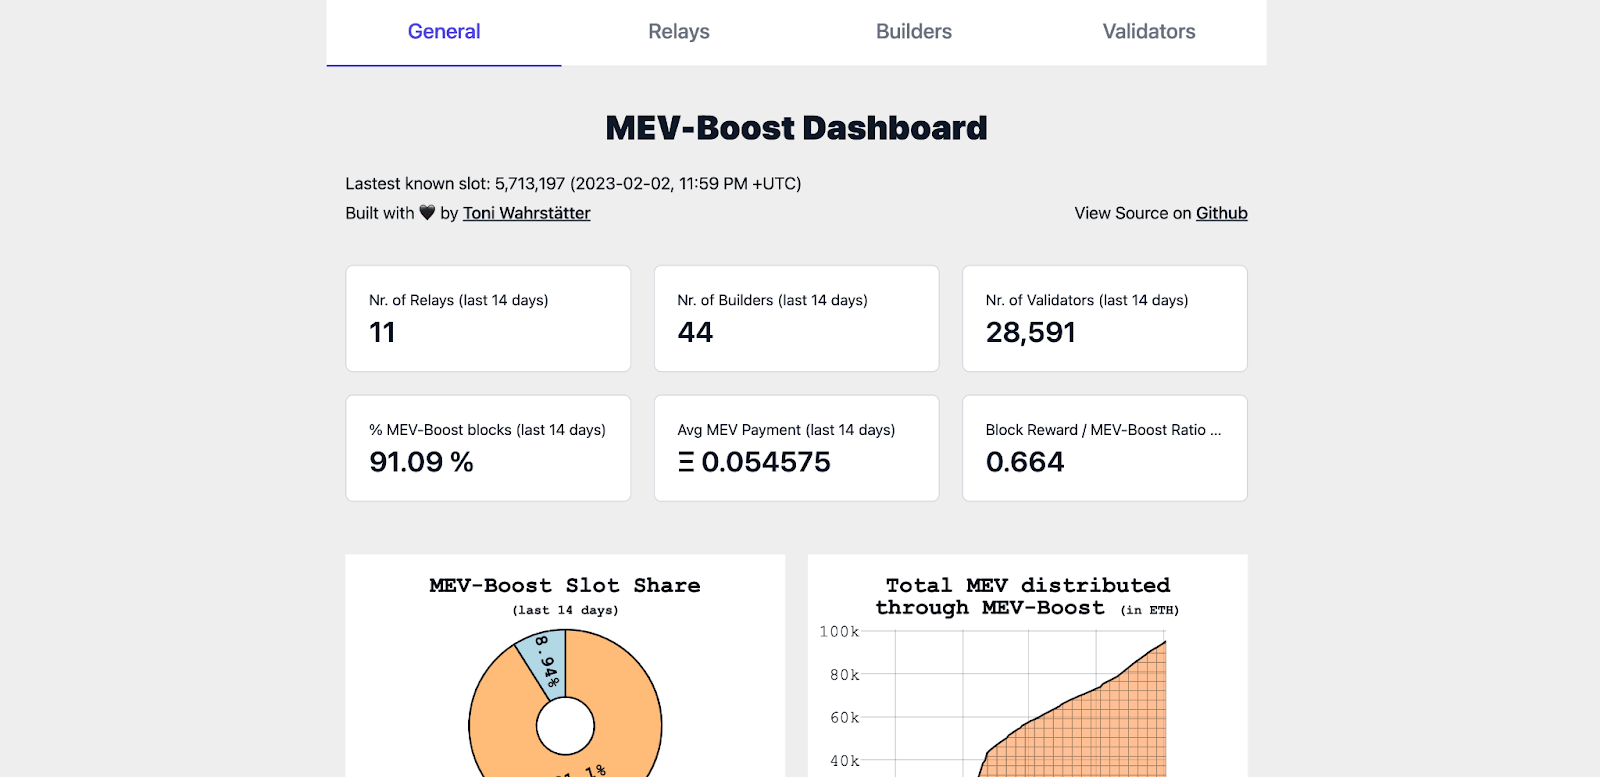
Also a relatively new dashboard in the space, mevboost.pics is one of the most comprehensive dashboards with regards to proto-PBS. With different tabs by audience it is easy to go to the sections that are most relevant to you. It isn’t fancy but has a ton of functionality when you start playing around with the data. One functionality we love is that you can download your views as a png to share with others.
Tips:
- Make sure to click on everything as you can add and remove different parts of graphs for more or less nuanced views
- Different views offer different functionalities. Make sure you hover over and look to see the different functionalities that pop up
Rated Network
Link: https://www.rated.network/relays?network=mainnet
- Purpose: Measure the performance of individual validator indices and groups of indices
- Audience: validators
- Created by: Rated Labs
- Open Source: ✅
- Cost: Free
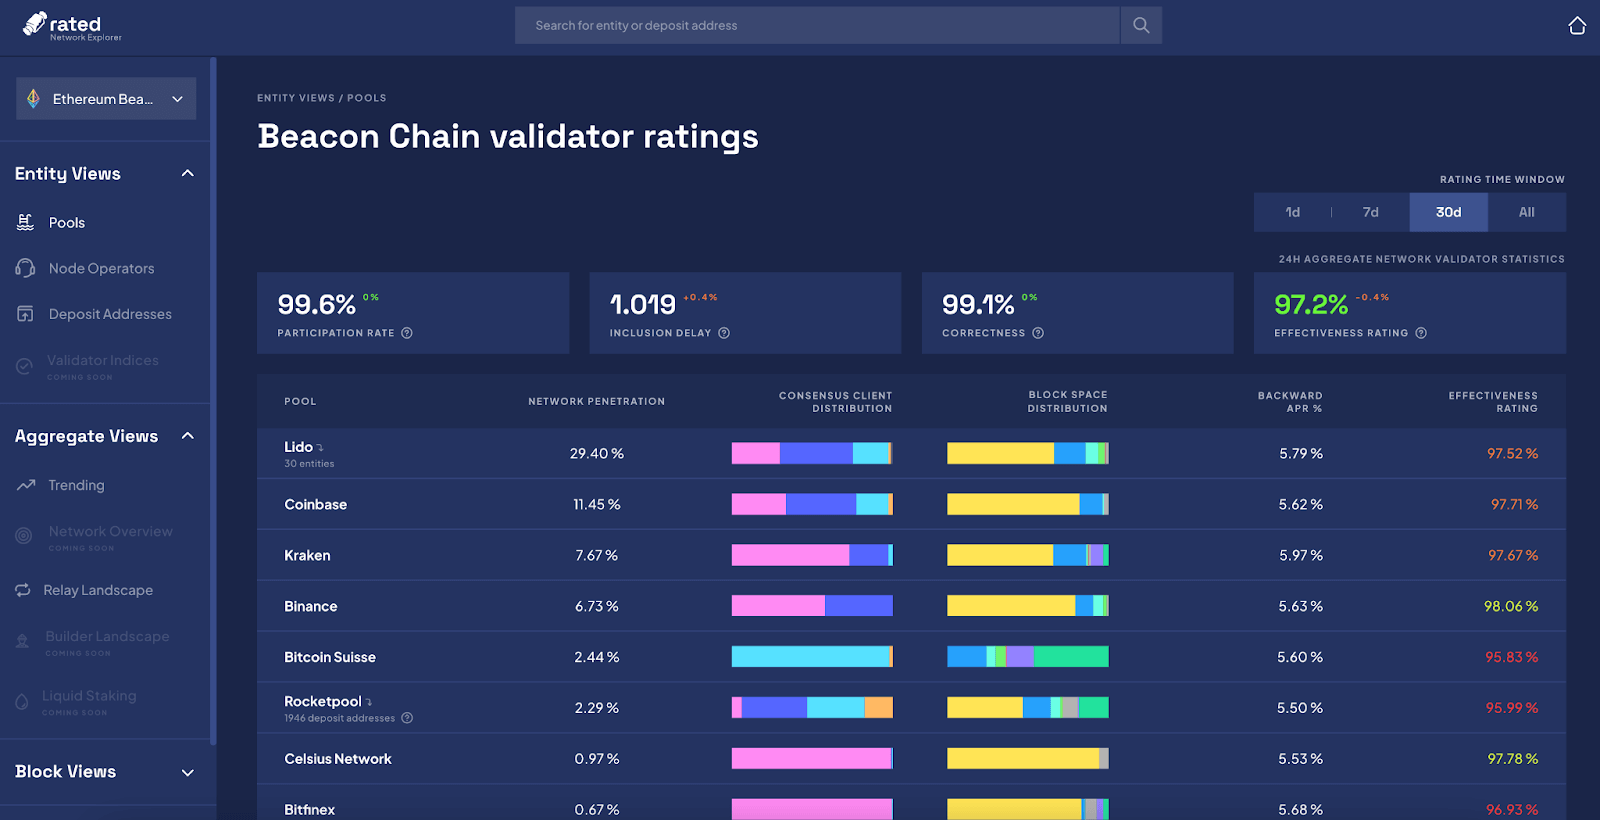
Rated seeks to solve the issue of monitoring validator performance to promote transparency on the Beacon Chain. The explorer, created with coordination from the Lido community, gives an overview of staking pools including their network penetration, consensus client distribution, block space distribution, APR, and effectiveness rating. You can dive deeper within each pool to understand how each operator is performing, what relays make up what percent of the blocks they are winning, and their backward looking APR. One of the most interesting features is the effectiveness rating of validators - read about how they calculate this in their docs here. Overall, we love the holistic view that Rated Network takes on the validator ecosystem and every time we come to Rated Network a new view appears that helps distill the information even more. This is definitely a dashboard to keep your eyes on.
Tips:
- Click through all the views on the left hand navigation to get a complete picture of what Rated is offering
- Rated does a great job of allowing you to click through and hover to get more information from a view so don’t be afraid to play around
- Double check your assumptions and read through their docs when you have questions
Zeromev.org
Link: https://zeromev.org/
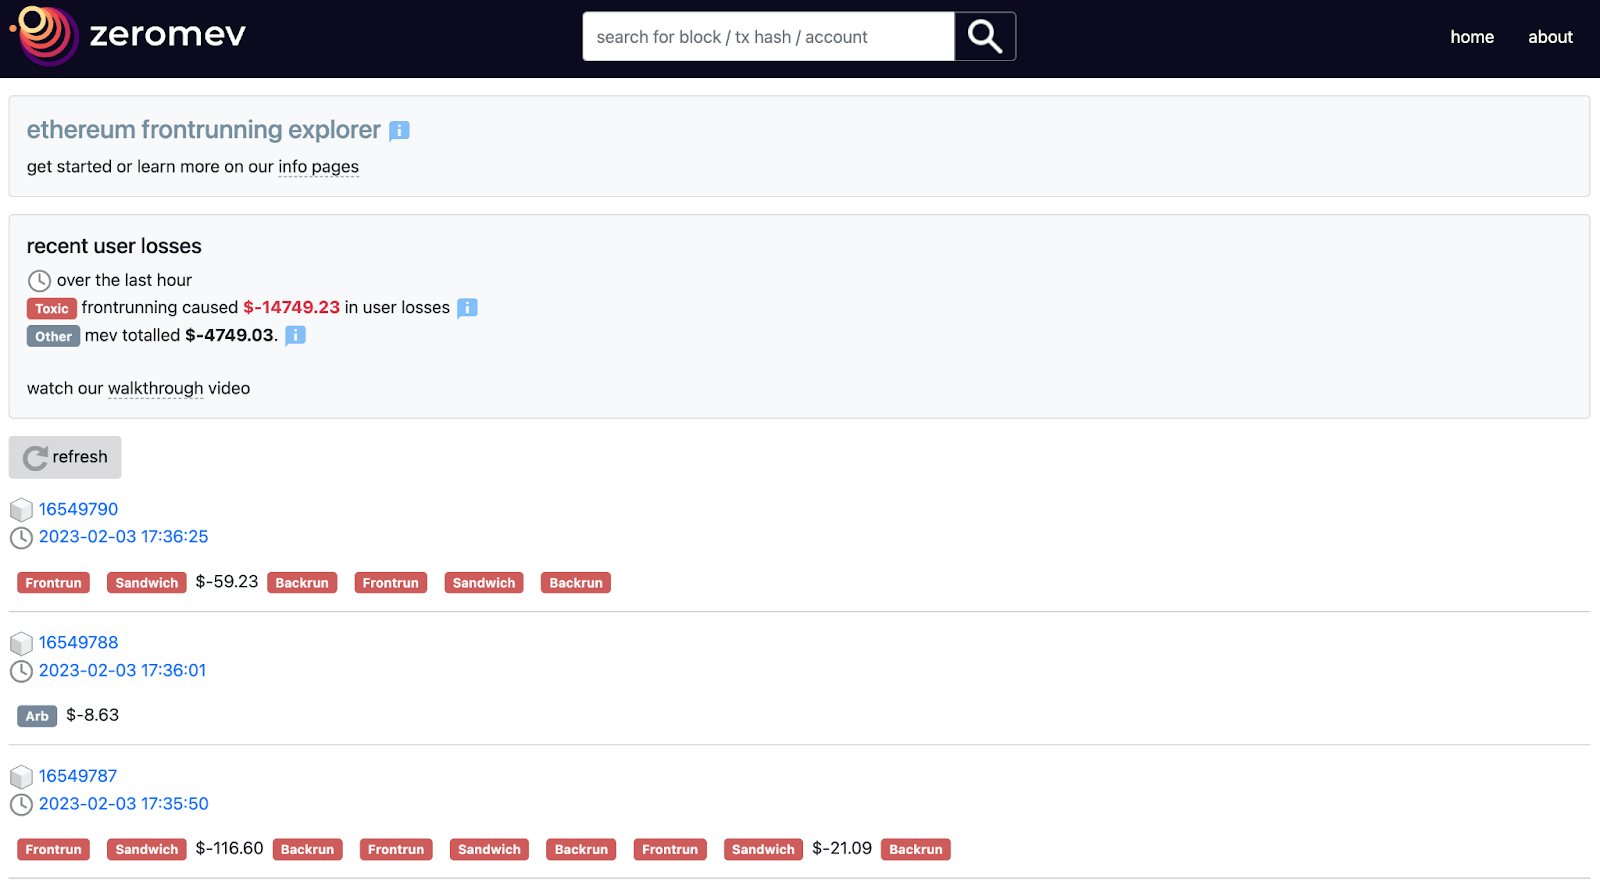
- Purpose: Visibility into transaction reordering (ie front running) on Ethereum
- Audience: anyone interested in the effects of MEV
- Created by: pmcgoohan
- Open Source: ✅
- Cost: Free
This dashboard/real time feed is great if you want to understand MEV and its implications in real time. You can click into each block to analyze the different transactions that took place. The interface has simple labels that are easy to follow and understand which you can easily click into to learn more. You can even dive deeper into each transaction within the block to analyze further through etherscan.
Beaconcha.in
Link: https://beaconcha.in/
![]()
- Purpose: Open source ethereum explorer. Monitoring tool for solo stakers.
- Audience: relay operators, block builders, searcher, validators
- Created by: Bitfly
- Open Source: ✅
- Cost: Free (but you can pay for more access)
The Beaconcha.in Dashboard is a powerful tool for managing your Validator operations. By specifying your monitoring endpoint on your beacon and validator node, beaconcha.in monitors your validators. It will alert you when necessary and give you a record of all your consensus and execution rewards. It is a great tool to ensure your validators are running smoothly and effectively. Pro tip: the mobile app is fantastic.
Additionally, beaconcha.in does a full breakdown of each proposed slot including the relay that won, MEV reward recipient, status, proposer, sync aggregate, execution payload,...the list goes on. This makes it one of the best tools for investigating blocks and troubleshooting as well as getting an snapshot overview of the state of the Ethereum network (ie number of validators, etc). We highly recommend you dive into beaconcha.in to discover the full functionality.
Building an Open, Decentralized Ethereum—Together
These dashboards, built by the community, for the community, are a testament to the decentralized nature of Ethereum. By making these projects open-source and free, the ecosystem is able to discover new insights and work together to pinpoint areas of improvement to make Ethereum more decentralized and robust. If you operate a dashboard and would like to be included please reach out on discord.
If you are a Validator looking to boost your rewards connect to the Blocknative Relay.