Unparalleled Insight into ETH Gas Prices
In Web3, having an accurate max fee is an important part of ensuring your transaction is picked up by miners. If you set a max fee less than the current base fee then your transaction will not be minable and may even become stuck or eventually dropped. Users that have submitted transactions during a period of rapidly rising base fees—such as during a hyped NFT launch—may know this experience all too well.
Currently, most ETH gas estimators use simple heuristics for setting a transaction’s max fee. These heuristics are often based on the worst-case scenario of maximum network congestion. Traditionally, Blocknative has used a similar heuristic.
The major issue with this method, however, is that it does not consider current mempool activity when calculating the max fee. This is why Blocknative has developed a more accurate way to predict gas fees based on real-time data and predictive modeling.
Using our global mempool infrastructure and existing machine learning pipelines, Blocknative is now able to provide users with future base fee predictions and more accurate max fee estimates so users can transact with confidence.
In this technical post, we will cover how our base fee predictions and intelligent max fee estimations work, and review performance metrics. If you need a refresher on gas fees, be sure to review our previous blog post, A Definitive Guide to Ethereum EIP-1559 Gas Fee Calculations: Base Fee, Priority Fee, Max Fee.
How Max Fee is typically calculated
Blocknative’s Gas Platform had traditionally determined the max fee as:
maxfee = 2 * basefee + predicted priorityfee
Because the base fee rises when blocks are more than half full under EIP-1559, calculating the max fee this way allows for a transaction to still be marketable for six consecutive 100% full blocks on Ethereum mainnet.
To demonstrate this, below we have included a table of base fees after various numbers of consecutive 100% full blocks using mainnet’s base fee multiplier of d=0.125.
|
Number of full blocks in a row, nn |
Current Base Fee |
Base Fee Multiplier, (1+d)n(1+d)n |
Final Base Fee |
|---|---|---|---|
|
1 |
100 |
(1+0.125)1=1.125 |
112.5 |
|
2 |
100 |
(1+0.125)2≈1.265 |
126.5625 |
|
3 |
100 |
(1+0.125)3≈1.424 |
142.3828125 |
|
4 |
100 |
(1+0.125)4≈1.604 |
160.1806640625 |
|
5 |
100 |
(1+0.125)5]≈1.802 |
180.2032470703125 |
|
6 |
100 |
(1+0.125)6≈2.027 |
202.7286529541 |
If users could know where the base fee is headed in the next few blocks rather than blindly assuming the worst-case scenario, they could set a lower, smarter max fee that would more accurately reflect what they would need to pay to be included in an upcoming block.
Introducing Intelligent Max Fees
Using our global mempool infrastructure and existing machine learning pipelines, Blocknative is excited to introduce an intelligent max fee in Gas Platform. This max fee is made possible by our new base fee prediction model that can predict with accuracy what the base fee will be in the next few blocks.
Using Intelligent Max Fees Results in a 16% Average Reduction in Max Fee
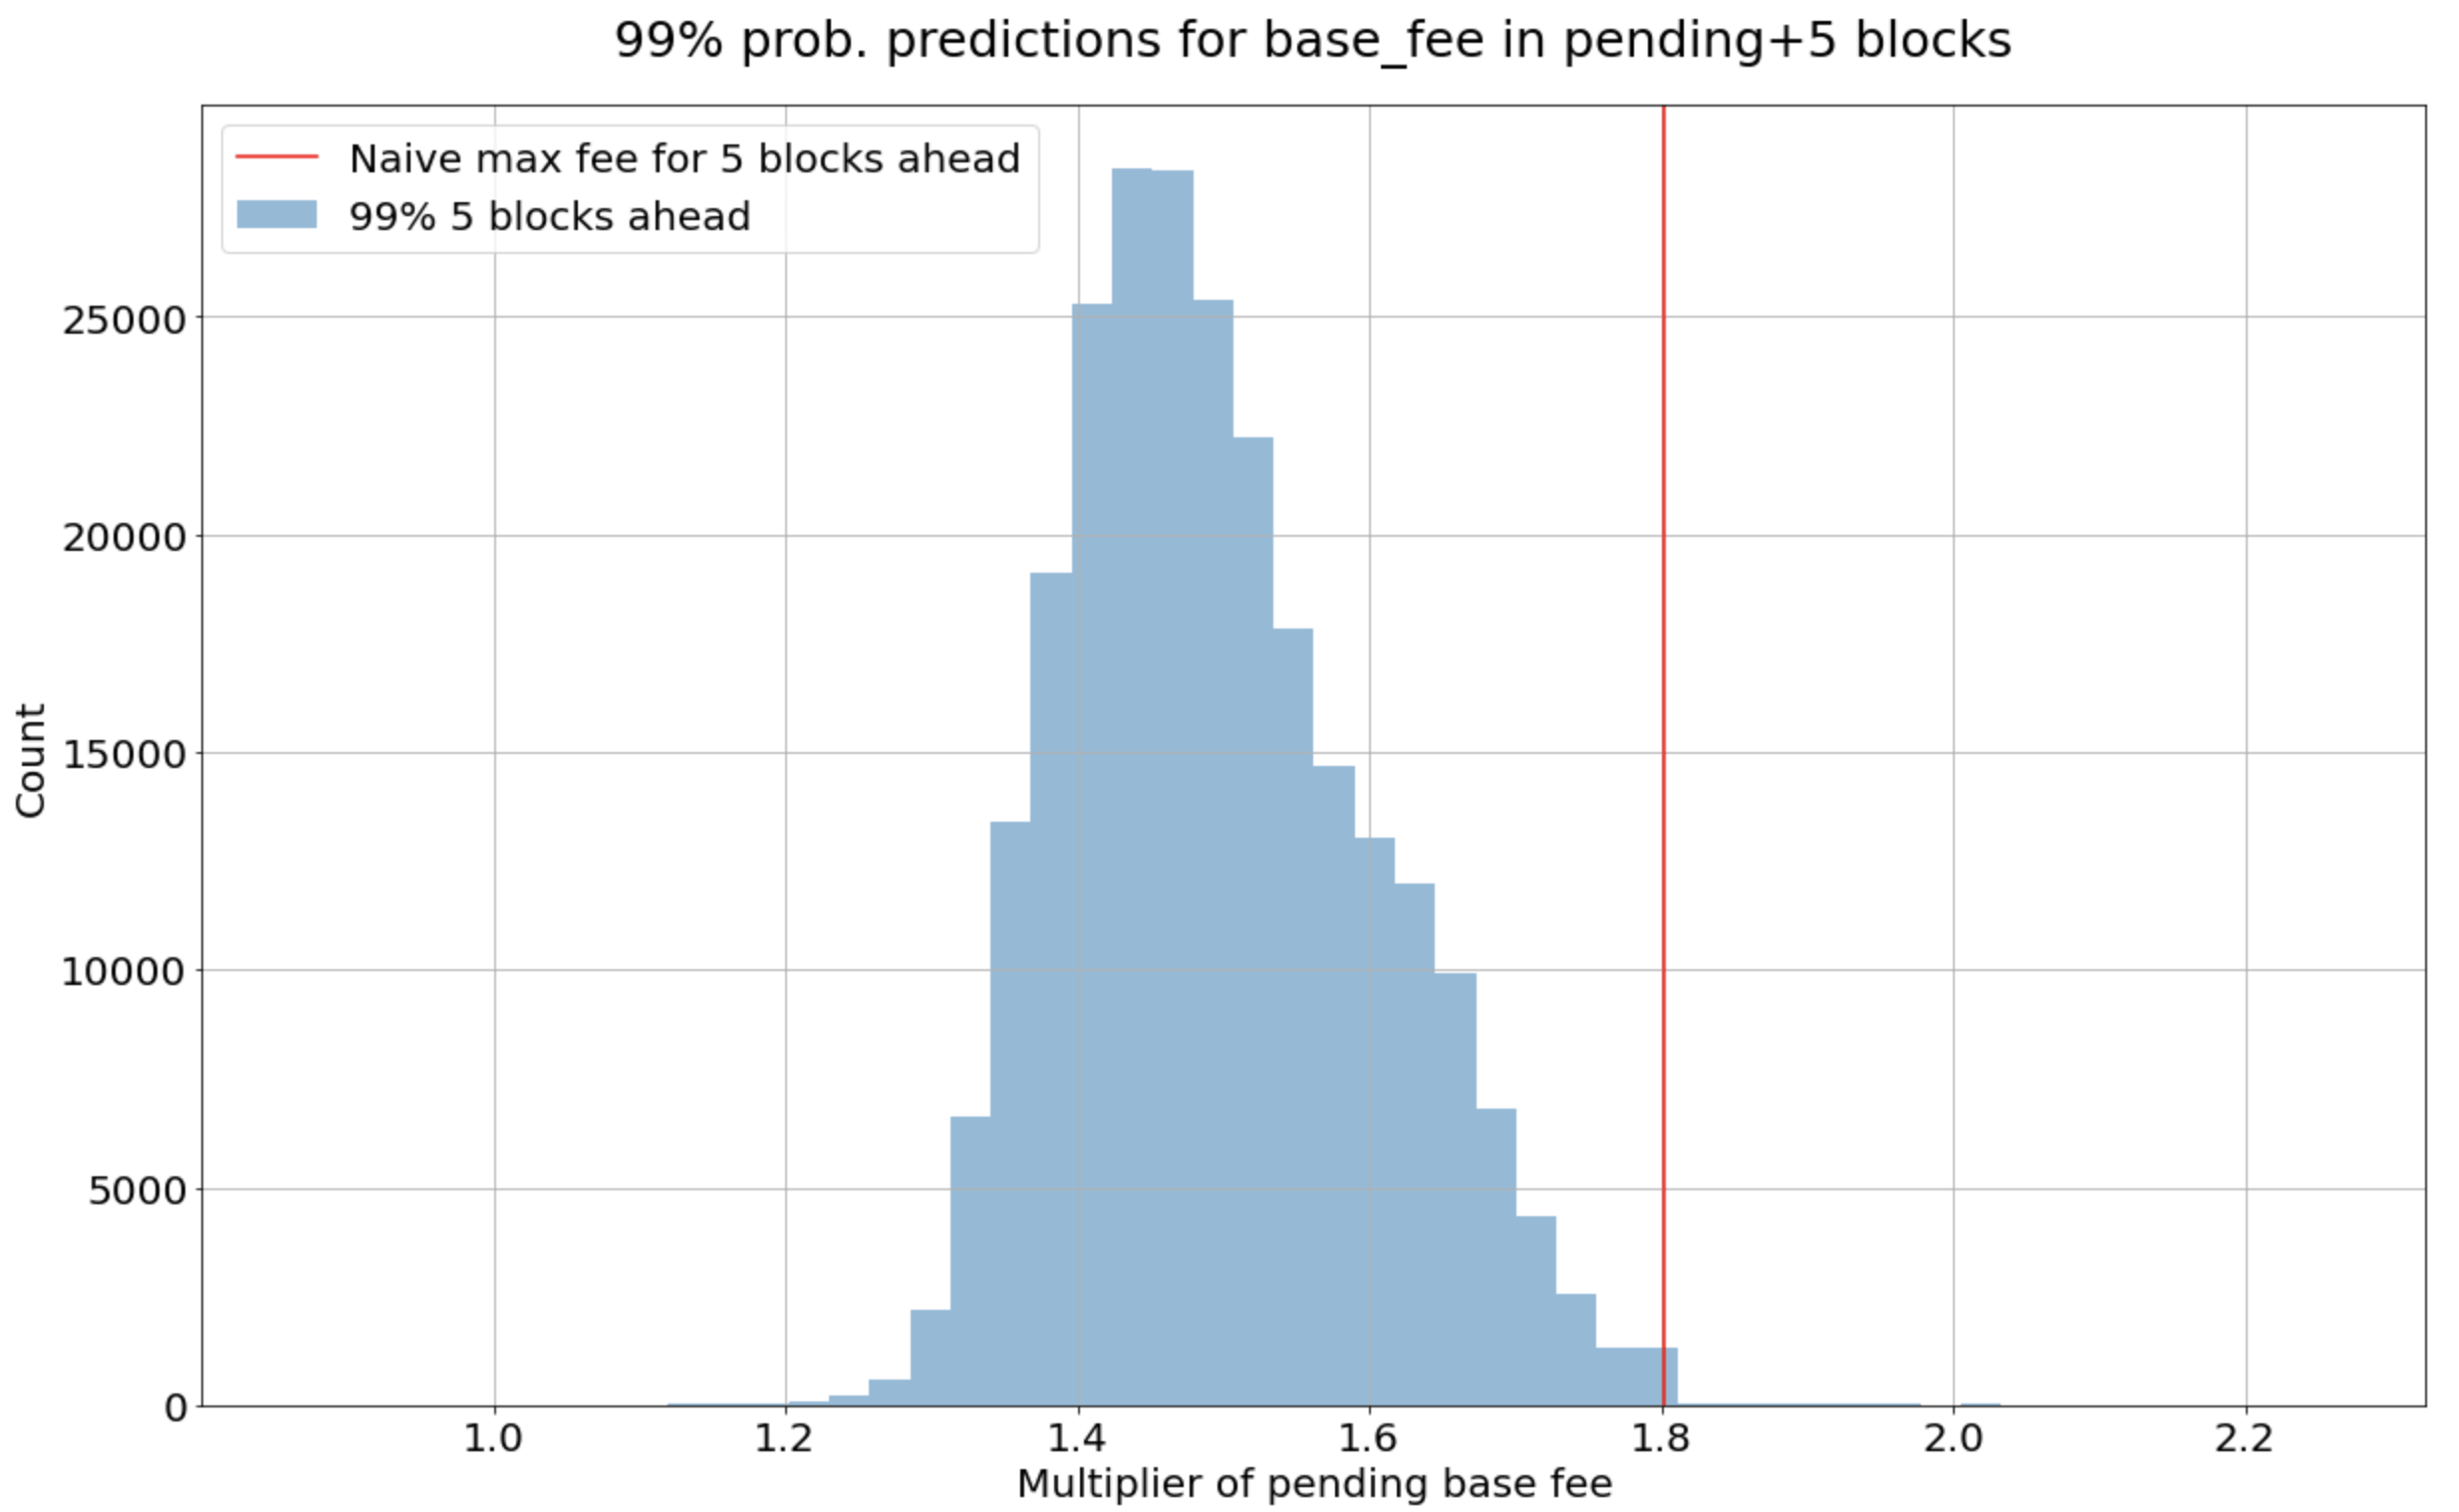
In testing this new model, Blocknative found that our intelligent max fee is tuned to be greater than the actual base fee about 99% of the time while still lower than the naive max fee that assumes 5 straight full blocks.
The mean max fee multiplier produced by the model is about 1.5. If we compare this to the naive (i.e. worst-case scenario) 5 block heuristic, this represents a (1.8−1.5)/1.8≈16% average reduction in max fee, while still being eligible after 5 blocks 99% of the time as demonstrated by the chart below.
Base Fee Prediction Model Details
The base fee prediction model is a quantile regression, neural network model and provides multiple predictions for up to 5 blocks ahead of the pending block.
For each of these 1, 2, 3, 4, and 5 blocks ahead of the pending block, a 1%, 5%, 50%, 95%, and 99% probability prediction is provided.
Prediction Example: Let the model’s 99% prediction for the base fee 3 blocks ahead be 120. The model is thus predicting that the base fee for the third block after the pending block will be less than or equal to 120 99% of the time.
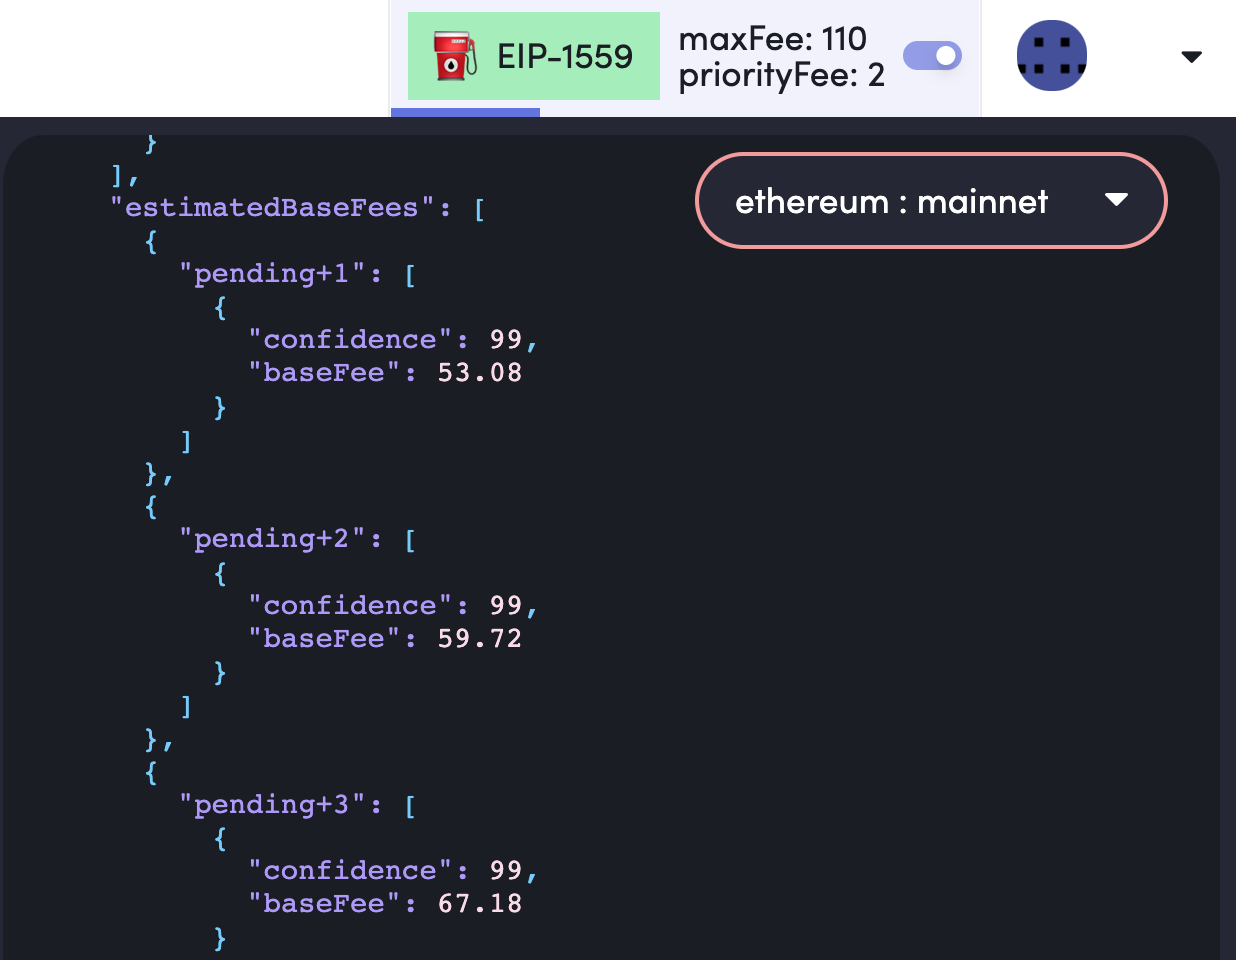
For a full breakdown of the estimatedBaseFees payload, be sure to visit our Gas Platform Documents.
Visualization of Model Prediction
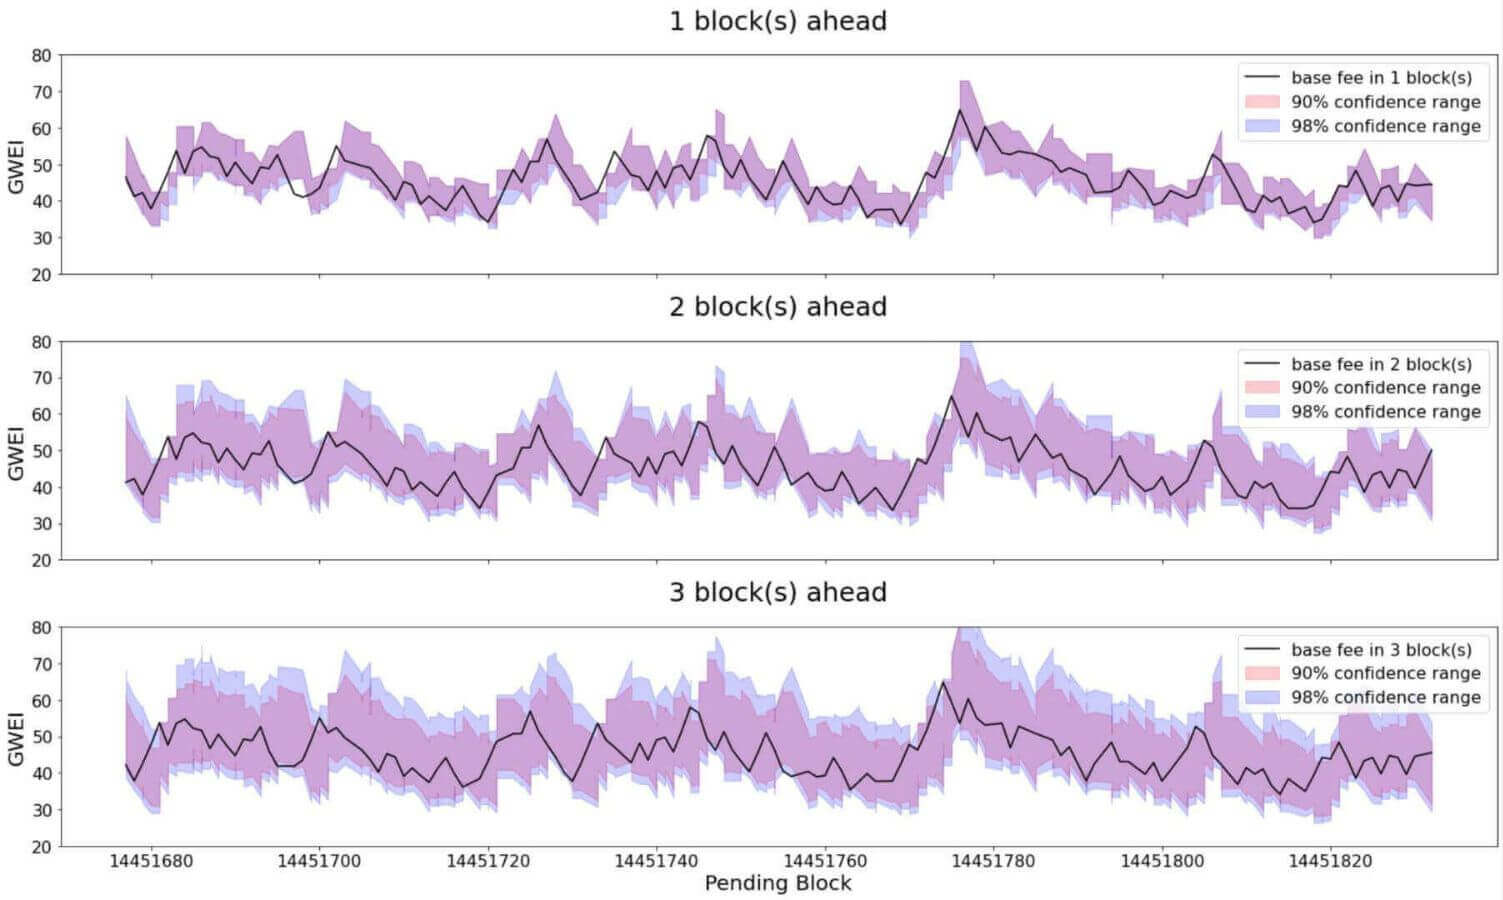
Below is a sample of our model’s base fee predictions on Ethereum mainnet over a 200-block period.
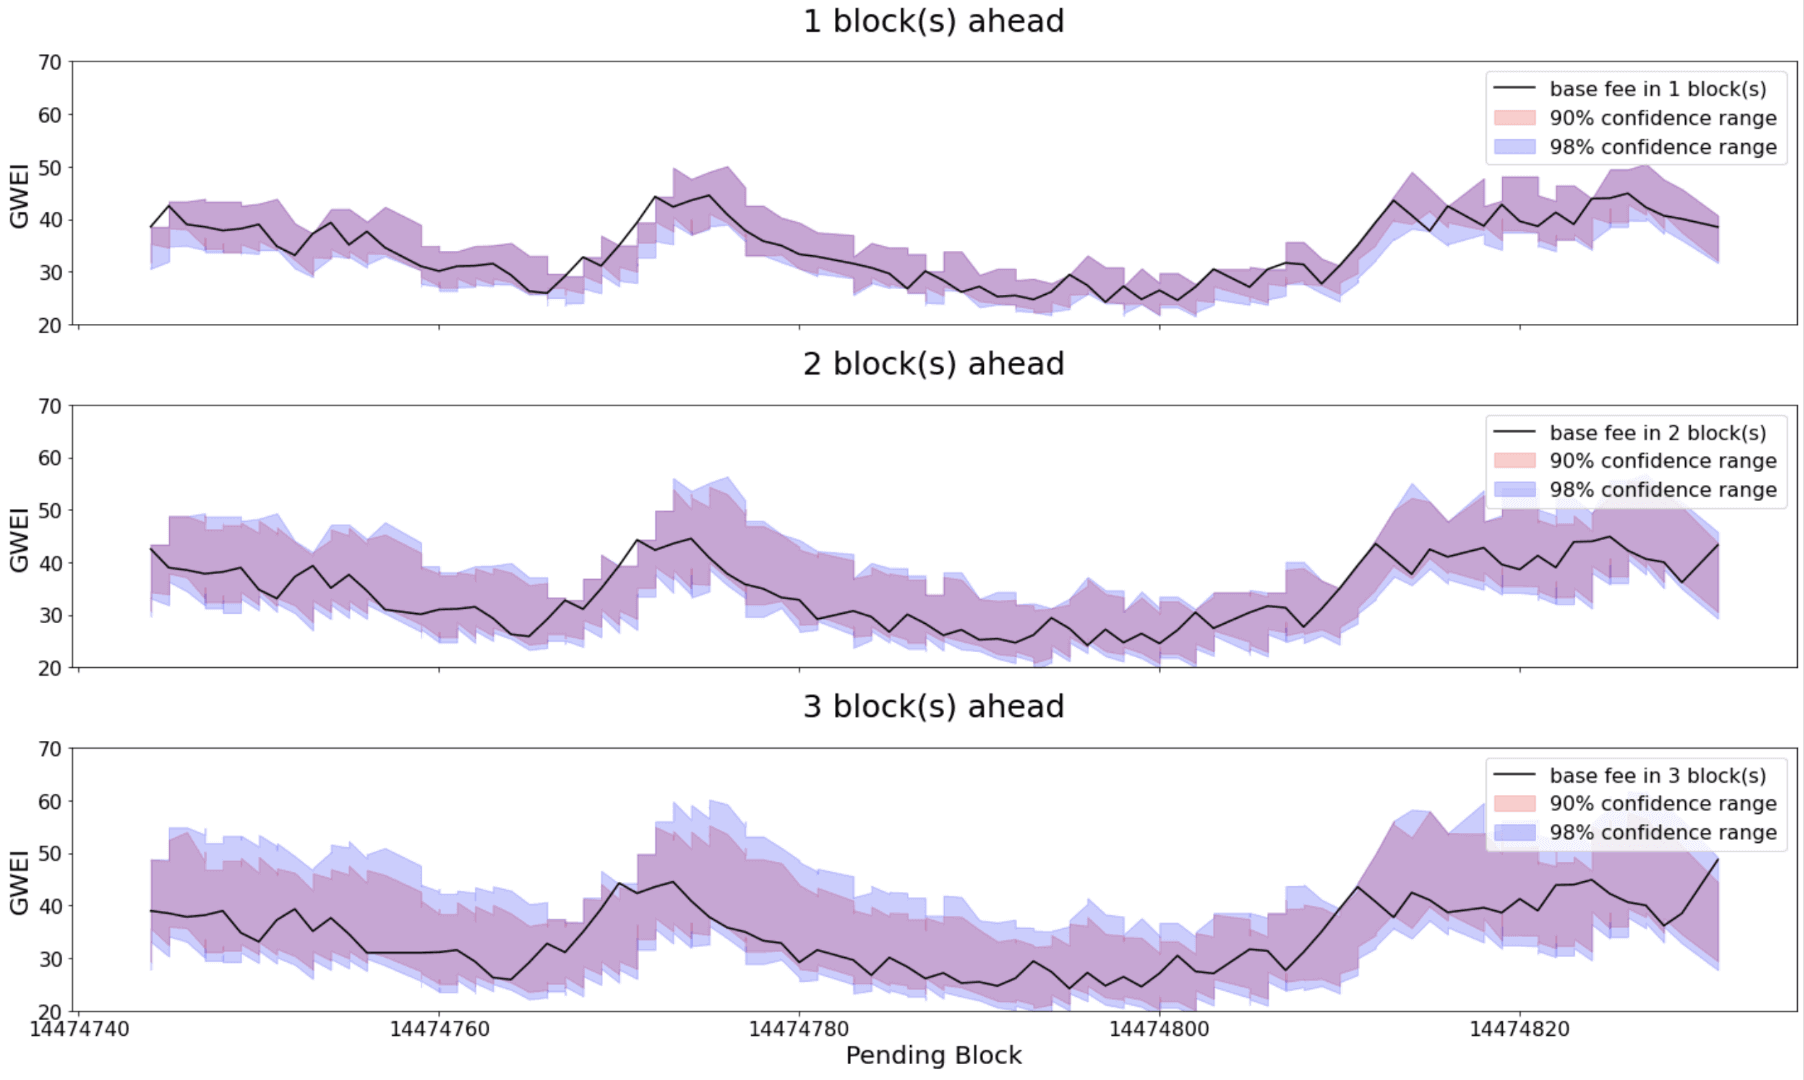
The 90% and 98% confidence intervals are shown and are constructed from the 5/95% and 1/99% probabilities respectively. The 90% confidence interval is the range the base fee will be within 90% of the time. The upper bound of the 90% interval is the 95% prediction, while its lower bound is the 5% prediction. Learn more about confidence intervals here.
The model’s prediction intervals are plotted alongside the actual future base fee that occurred after 1, 2, and 3 blocks ahead.
More predictions for a different time frame:
Examining Model Errors for Different Blocks Ahead
Let us look at the 99% predictions for 1, 2, 3, 4, and 5 blocks ahead.
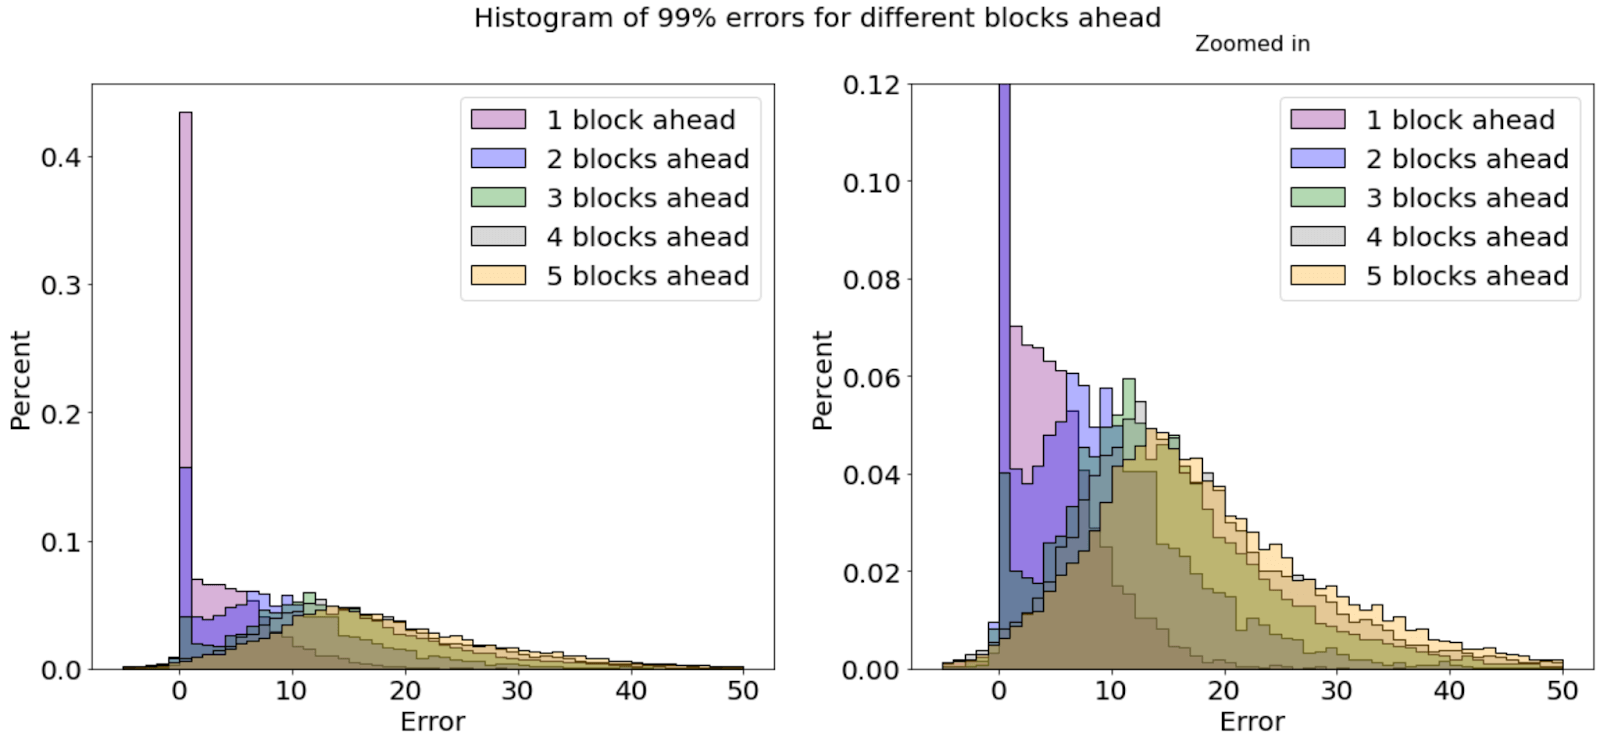
Notice two things from the above error plot:
- As the model tries to predict further in the future (higher blocks ahead) the number of errors increases.
This is intuitive. There will be more uncertainty about base fees that are further into the future because there is less current mempool activity that is applicable to the base fee calculation for those blocks.
- For the 1, 2 and 3 blocks ahead predictions, there are some base fees that are predicted with little to no error.
The 1, 2, and 3 blocks ahead distributions are bi-modal, with a noticeable spike near 0. These spikes represent very good performance by the model, with near-perfect predictions.
Notice these spikes are absent from the 4 and 5 blocks ahead, which shows the inability to provide completely error-free predictions at these levels.
Examining Model Errors for Different Percentage Predictions
The below histogram shows different percentage predictions for 5 blocks ahead only.
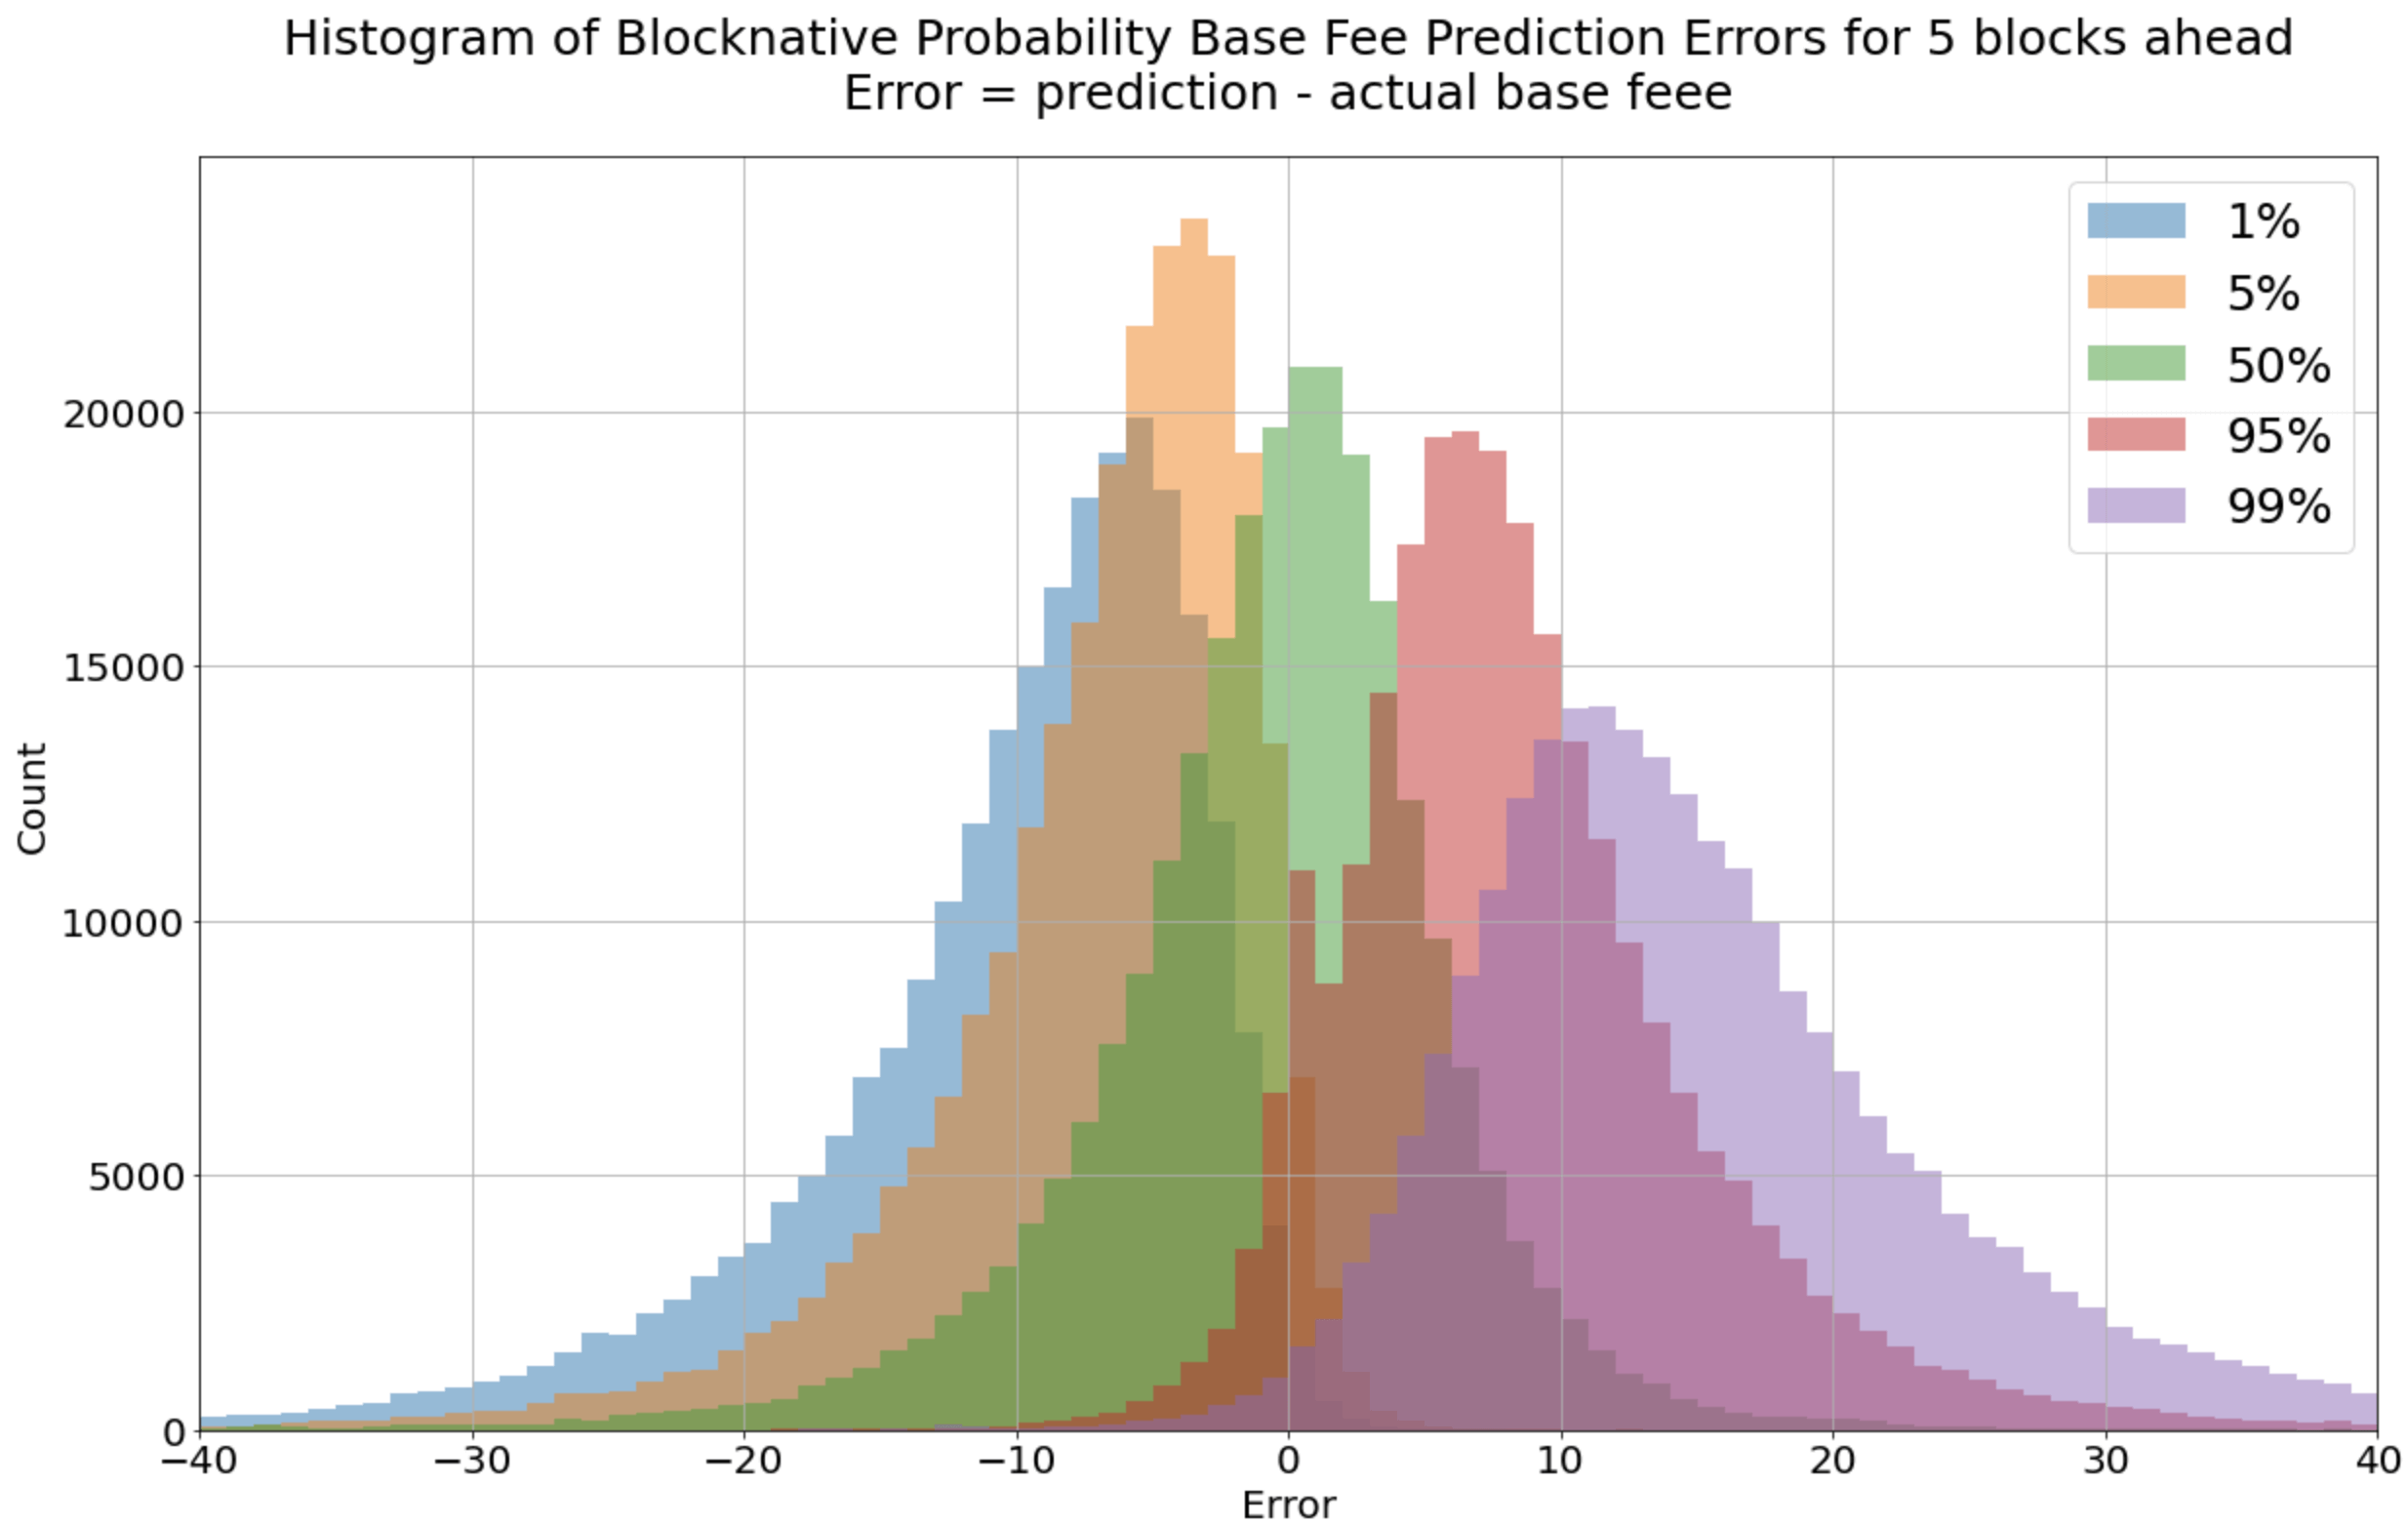
As expected, the higher the probability of a prediction, the higher the error rate. In this case, the more certainty needed for a max fee to be greater than the future base fee, the higher that max fee needs to be.
Model Performance Metrics
Quantile Analysis:
The table below looks at mainnet max fee predictions over a specific time period and shows the percentage that each prediction was adequate (greater than the actual base fee).
Time Period: 3/22-3/28
|
blocks ahead |
99% quantile, % |
95% quantile, % |
50% quantile, % |
5% quantile, % |
1% quantile, % |
|---|---|---|---|---|---|
|
1 |
97.7 |
97.0 |
55.4 |
4.6 |
1.3 |
|
2 |
98.8 |
95.2 |
47.0 |
4.1 |
0.6 |
|
3 |
98.7 |
93.7 |
48.5 |
4.5 |
0.9 |
|
4 |
98.7 |
93.9 |
49.4 |
4.9 |
0.9 |
|
5 |
98.7 |
94.0 |
49.6 |
5.3 |
1.0 |
Overpayment Analysis:
We could easily achieve a naive 100% probability prediction by setting the max fee to 1,000,000 GWEI. While doing so would achieve our desired percentage, this would represent massive overpayment.
As mentioned before, providing greater probability requires greater overpayment. Our new model was created to minimize this overpayment.
The optimization process of the model focuses on:
- The performance of the given quantile—i.e. is the 95% prediction adequate about 95% of the time? This is demonstrated in the table above.
AND
- The minimum amount of overpayment to achieve the given quantile—i.e. we want to pay as little as possible to guarantee a 95% probability of being adequate.
The mean overpayment is calculated as follows.

Example:
If Mean Overpayment Percent=30, the model predicts a value on average 30% greater than the actual base fee.
Here is the model’s overpayment over the following time period.
Time Period: 3/22-3/28
MOP=Mean Overpayment Percent
|
blocks ahead |
99% MOP, % |
95% MOP, % |
50% MOP, % |
5% MOP, % |
1% MOP, % |
|---|---|---|---|---|---|
|
1 |
7.1 |
7.1 |
0.6 |
-10.4 |
-15.2 |
|
2 |
19.4 |
16.8 |
-0.3 |
-14.0 |
-17.4 |
|
3 |
31.7 |
23.1 |
-0.5 |
-16.7 |
-21.3 |
|
4 |
38.3 |
26.5 |
-0.2 |
-18.3 |
-23.7 |
|
5 |
43.5 |
29.5 |
0.1 |
-19.5 |
-25.5 |
Other Potential Uses for Base Fee Prediction
In addition to setting an intelligent max fee, the base fee prediction can also be used to
- Show the general trend of base fees
- Provide probabilities for longer-term timeframes. 5 minutes, 30 minutes, 1 hour, etc.
Transact with Confidence Using Blocknative’s Base Fee Prediction and Intelligent Max Fee
Users can see our Intelligent Max Fee estimates in real-time on any of our Gas Platform payloads today. This includes our Gas Estimator Browser Extension, as well as our ETH Gas Platform APIs.
Base Fee prediction payloads are also available to all Gas Platform users. New Blocknative users can create a free Mempool Explorer account and see these gas payloads in action. Or jump right into our Gas API documents and start building today!
Please join our Discord Community and let us know what you think. Our team is here to help if you have any questions, concerns, or recommendations.
Gas Extension
Blocknative's proven & powerful Gas API is available in a browser extension to help you quickly and accurately price transactions on 20+ chains.
Download the Extension